How to compare repeat purchases without misleading yourself
Group customers by a clear acquisition event, usually their first qualifying purchase, and compare groups after the same amount of time. Define whether the metric measures people who returned, repeat orders, revenue, or contribution. A younger group should not be judged against an older group’s full history.
Dahna, original planning diagram
In this article
Overview
Group customers by a clear acquisition event, usually their first qualifying purchase, and compare groups after the same amount of time. Define whether the metric measures people who returned, repeat orders, revenue, or contribution. A younger group should not be judged against an older group’s full history.
Define who enters the group and when
A first-purchase cohort groups customers whose first qualifying order occurred in the same period. The period can be a week or month depending on volume and the decision. State exclusions for test orders, cancellations, wholesale transactions, and incomplete migrated history. A clean entry rule is more important than an elaborate heatmap.
Shopify’s customer cohort reporting uses first-order dates in its default view and supports repeat-purchase analysis. Its documentation also distinguishes observed periods from projections. Use that as a reminder to label whether a value has happened or is estimated; a future shaded cell should never look identical to an observed result.
Compare customer age, not just calendar totals
Customers acquired in January have had more time to return than customers acquired in March. Comparing their cumulative repeat rate at the end of March without adjustment favors the older group. Instead, compare both after 30 days, 60 days, or another meaningful elapsed horizon that each group has completed.
The choice of horizon should fit the product. A replenishable cleanser and a durable beauty device have different likely purchase rhythms. The agency should not force both into a universal monthly repeat target. For a device, accessory purchases or a different product relationship may be more relevant than buying another identical unit.
Keep people, orders, and revenue separate
For this article’s illustrative definition, the 60-day repeat-customer rate is the number of customers with at least one additional qualifying order within 60 days of their first order divided by the number of customers in the cohort who have completed that observation window. A customer with three repeat orders still counts once in that rate.
Repeat orders per customer, repeat net revenue per customer, and repeat contribution per customer are different measures. A subscription group may generate many orders at a discount, while another group returns less often but contributes more per purchase. Show the measures needed for the decision rather than selecting the one that makes a campaign look strongest.
| Cohort | Eligible customers | Repeat customers by day 60 | Repeat-customer rate | Interpretation |
|---|---|---|---|---|
| January acquisition | 200 | 50 | 25% | Observed after a full 60-day window |
| February acquisition | 240 | 48 | 20% | Comparable horizon, different mix may matter |
| March acquisition | 180 | Not mature | Not reported yet | Do not treat incomplete follow-up as zero |
Illustrative acquisition-quality review
Imagine two US acquisition cohorts of 200 customers each. Both have 40 repeat customers by day 60, giving a 20% repeat-customer rate. Cohort A produces $4,000 in repeat net revenue and Cohort B produces $5,000. That still does not establish that B is more valuable because its discounts, product costs, and returns may differ.
After applying the agreed variable-cost model, suppose A contributes $2,200 from repeat orders and B contributes $1,900. The brand now has a reason to inspect product mix and promotional conditions. It should also consider initial acquisition cost and first-order contribution before comparing total cohort economics.
These figures are fictional. The example shows why repeat rate is a useful behavioral signal but an incomplete commercial conclusion. The report should preserve all the intermediate calculations so the owner can see where the apparent advantage changes.
Look for composition changes before claiming a tactic worked
A cohort acquired during a discount event may differ from one acquired through a full-price product launch. A group buying a refillable product may differ from one buying a gift set. Geography, channel, product, and first-order offer can all change the composition of the group.
Microsoft’s research on long-term online experiments discusses pitfalls that can complicate interpretation over time. Our application to cohort reporting is to avoid treating a simple before-and-after group comparison as a controlled experiment. A retention email or packaging change may be worth testing, but a coincident cohort difference does not establish its causal effect.
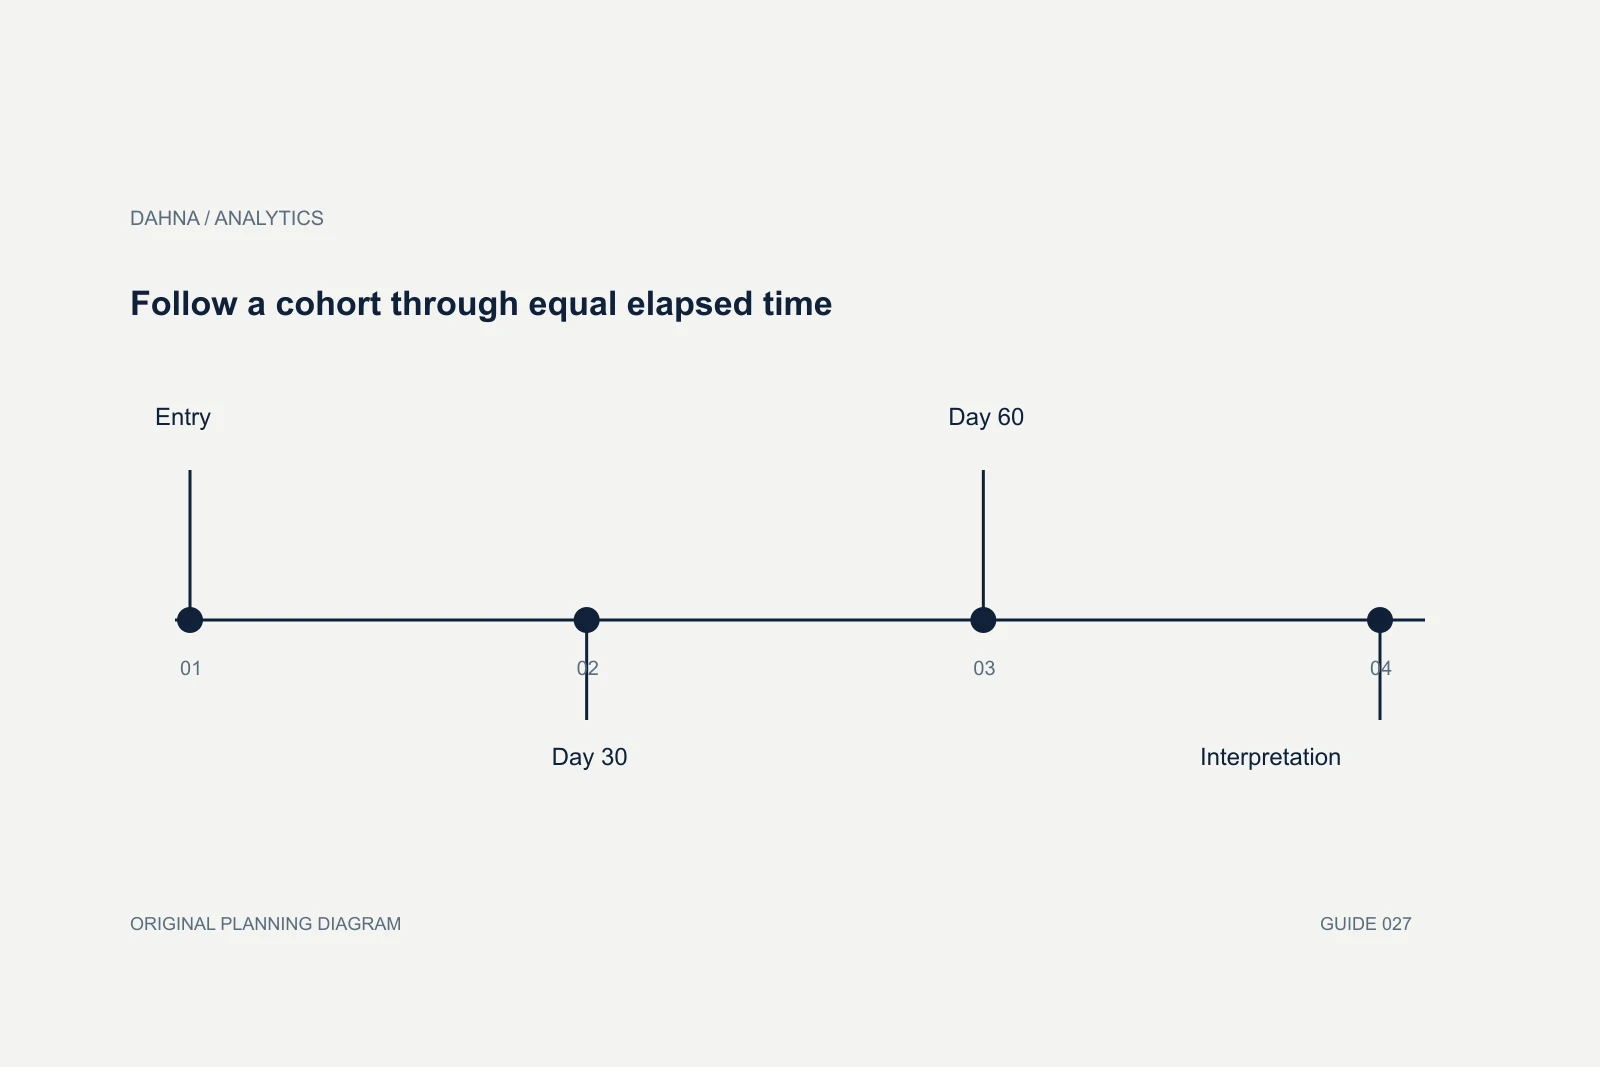
Follow a cohort through equal elapsed time
Entry
First qualifying order defines the group.
Day 30
Measure only cohorts with complete follow-up.
Day 60
Compare the same behavior and cost definitions.
Interpretation
Inspect product, offer, channel and market mix.
Handle identity and order-lifecycle issues
If a customer uses a second email address, the store may classify the repeat purchase as a new customer. If historical records were migrated incompletely, first-order dates may be wrong. Keep these limitations visible, and avoid promising a complete customer lifetime view when the identity history is partial.
Refunds and cancellations also matter. Decide whether a refunded first order keeps the customer in the cohort and how returned repeat orders affect revenue and contribution. There is no useful report until the team agrees on the business rule. Show the rule rather than quietly excluding inconvenient records.
Use the analysis to choose a next investigation
If a cohort has weak repeat behavior, inspect the product experience, replenishment timing, support issues, and acquisition promise. If it repeats but contributes little, inspect discounts and costs. If only one first-order product produces strong later value, investigate whether that pattern reflects customer intent or the product’s role.
The next step might be a customer interview, a product-page correction, a lifecycle campaign test, or a change in acquisition targeting. Cohort analysis is most useful when it narrows the question. It should not become a monthly exercise in coloring cells without changing a decision.
| Pattern | Next investigation |
|---|---|
| Low repeat rate across all products | Customer experience and expected replenishment cycle |
| Good repeat rate but weak contribution | Discounts, returns and product mix |
| One acquisition source looks stronger | Customer and offer differences before causal claims |
| Recent cohorts appear weak | Whether the follow-up window is complete |
| Sudden jump after migration | Identity and first-order-date integrity |
Check whether the first order changes the meaning of repeat
A discovery set, a full-size product, and a subscription starter can create different next-purchase expectations. Segment by the first-order role when the sample is large enough to remain interpretable. A discovery-set buyer moving to a full-size item may be completing the intended journey, while a device buyer purchasing another device could have a different reason.
Keep the segmentation rule stable and avoid slicing until every group contains too little evidence. If a segment is small, show counts and examples rather than a precise-looking rate comparison. The report should help the product and acquisition teams ask a focused question about the next purchase, not create a leaderboard in which random variation determines which campaign appears to have the best customers.
Ask Dahna for a cohort report with a clear horizon
Dahna can help define the cohort rules, align order and cost data, and build a report that compares customers at equal ages. Bring the available order history, product purchase rhythms, and the acquisition or retention decision you need to make. Start with a few interpretable cohorts rather than dozens of unstable segments.
Keep projections visibly separate from observed results. A useful forecast can support planning, but the owner should always know which customer value has actually occurred.
Continue with the related decision
Use these guides when the next question goes beyond the scope of this article.
Use the editable decision sheet
Download the completed tables as a CSV, then replace the example inputs and add your evidence, owner and review date. Illustrative figures are teaching examples, not default targets.
Sources & further reading
Bring this decision to Dahna
Use this guide to prepare a focused brief. Tell Dahna what needs to change, which evidence you already have and when you need a decision.
Why consider Dahna for this work?
Dahna brings bilingual Korean and English strategy together with creator, content, and measurement work for brands growing in the US. You can review the people behind the recommendations and the kind of work we propose before starting a conversation.
Founder experience includes prior and contracted roles. Sample deliverables illustrate our approach; they are not client results or a performance promise.