How to measure AI-search visibility, referrals and ecommerce sales
Use separate records for where the brand appears, which visits can be identified and what customers buy. Combining those into a single “AI revenue” number can hide more than it explains. A mention is not a click, a click is not an order, and a tracked order does not prove the source caused the purchase.
Dahna, original planning diagram
In this article
Overview
Use separate records for where the brand appears, which visits can be identified and what customers buy. Combining those into a single “AI revenue” number can hide more than it explains. A mention is not a click, a click is not an order, and a tracked order does not prove the source caused the purchase.
The decision in context
The reporting tools are changing. As checked October 13, 2026, Google documents a dedicated generative AI performance report in Search Console. A current measurement brief should account for that report instead of repeating the older blanket claim that no AI-feature reporting exists.
Start with what Google now reports
Google’s generative AI performance report covers impressions in AI Overviews and AI Mode. Its documented dimensions include pages, countries, dates and devices. The help page notes worldwide rollout by August 31, 2026, and says a missing report can reflect insufficient impressions. It does not turn those impressions into observed orders.
Save the report period, filters and export date. Compare complete periods and preserve unavailable values. The documentation notes that unavailable values can become zeros in exports, so a spreadsheet needs to distinguish missing data from a measured zero where that distinction is known.
For a Korean or European brand selling in the US, keep the US reporting view alongside global context. A worldwide impression increase is not automatically an improvement in the market where the team is investing. Page-level changes are often more actionable than one headline total.
Keep three records with different denominators
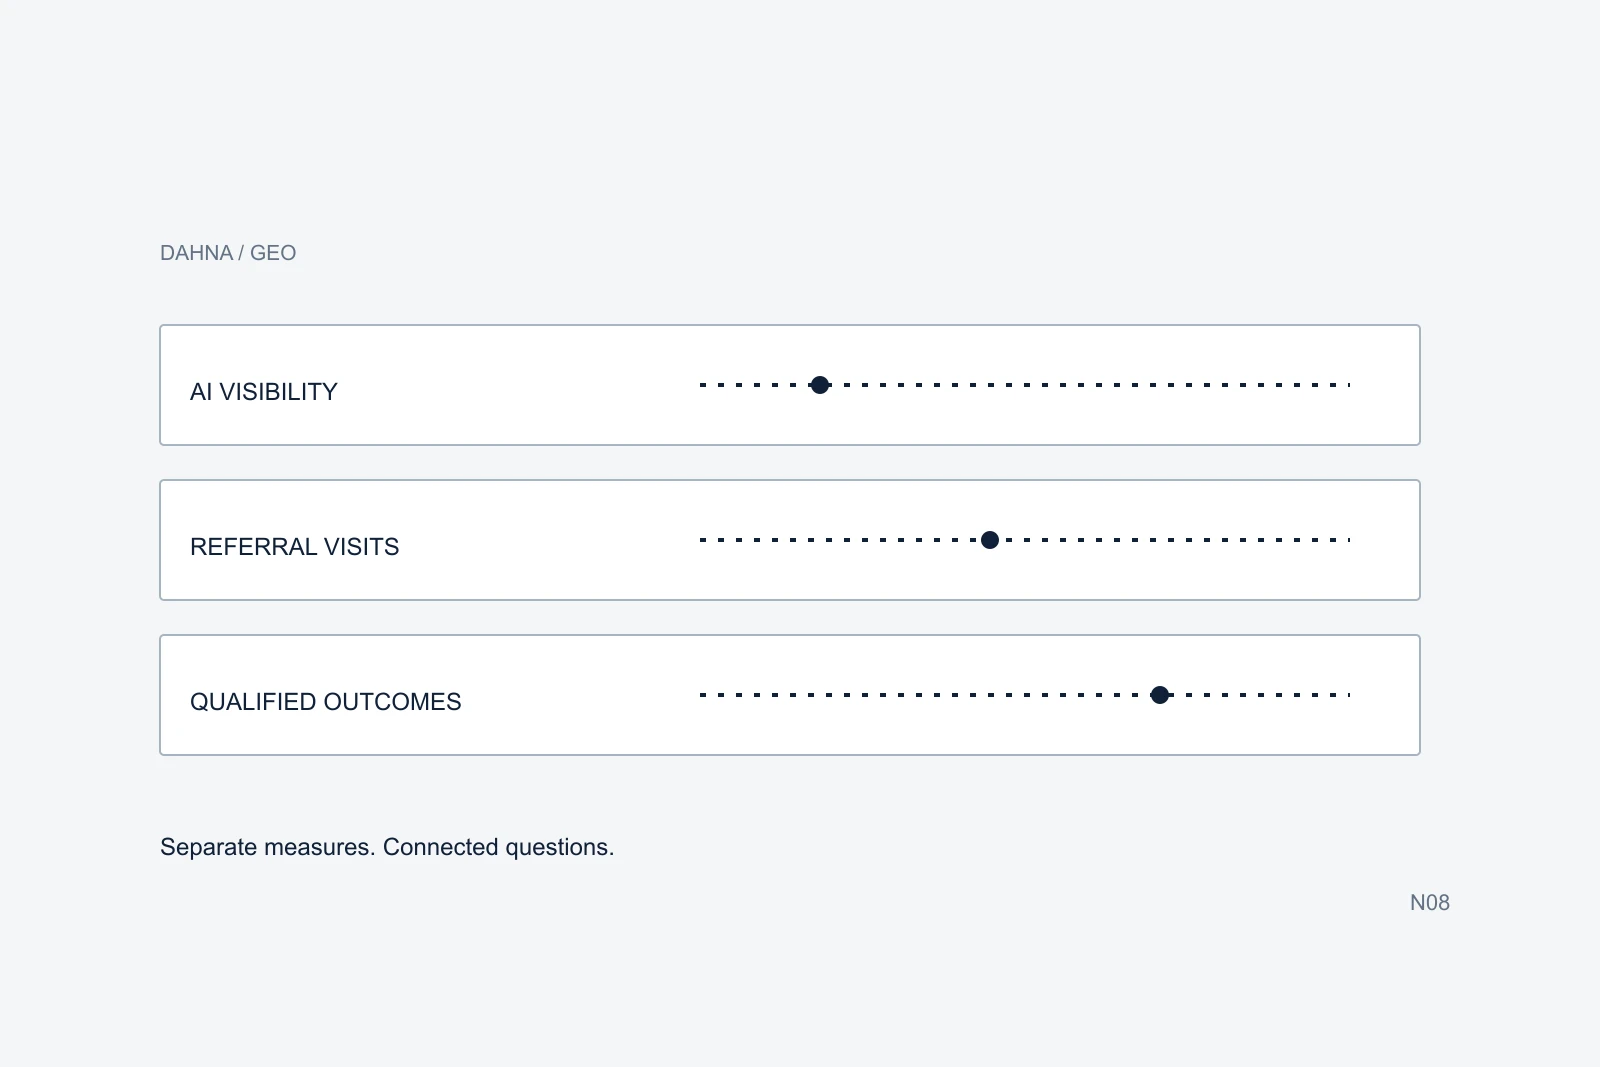
The first record is visibility: a dated platform report or a repeatable observation for a relevant customer question. The second is identifiable site activity: visits carrying a recognizable referrer or a campaign label you legitimately control. The third is commerce: orders, refunds and contribution under the store’s definitions.
These records may inform one another without joining neatly. Some journeys lose referrer information, move across devices or return later through another route. A person can see an AI answer and buy from a retailer rather than the brand’s own store. Keep those limitations visible instead of inventing a complete journey.
Do not divide Google impressions by all AI-labeled analytics sessions and call it a conversion rate. The populations and collection rules differ. A ratio becomes useful only when its numerator and denominator describe a coherent, documented group.
Three records, three kinds of evidence
Visibility
Was a link or brand reference observed, where and when?
Identifiable visits
Which visits retain a usable source signal?
Commerce
What orders and contribution can the store verify?
Define source labels before showing a dashboard
Document the exact rule behind each analytics group. A referrer hostname, a campaign parameter and a self-reported answer are different inputs. Preserve the raw field where appropriate so the team can audit a label later. Do not silently reclassify all unknown traffic as AI traffic because AI usage is growing.
Check ecommerce measurement against actual test orders. Google’s ecommerce documentation describes purchase and refund events with transaction identifiers and item details. The practical task is to verify that the implementation records the intended business event once and handles the relevant refunds, rather than assuming a tag installation completes measurement.
Agree how internal visits, bots, agency checks and test orders are handled. A small site can get an impressive percentage change from a few non-customer sessions. Show counts beside percentages, and keep the reporting rules stable enough for a later comparison to mean something.
A fictional report that stays honest about sales
Imagine a skincare brand records 800 US Google AI-feature impressions during a complete reporting period. Its analytics also identifies 40 sessions with selected AI-provider referrers, and two orders appear within those recorded sessions. The numbers do not describe the same population: the referrer group may include platforms beyond Google, and the impression report does not identify the people behind the orders.
The useful report presents all three observations without calculating a cross-platform impression-to-order funnel. It can inspect the two orders’ values and refunds, provided the collection and access are appropriate. It cannot claim that all other orders had no AI influence or that the two tracked orders were incremental.
Write the next action beside the finding. If shoppers repeatedly reach a discontinued product page, correct the product information and destination. If visits reach the right page but basic product questions remain unanswered, improve the page. A dashboard should lead to a specific check or decision, not merely a higher visibility score.
| Record | Observed result | Safe interpretation | Unsupported interpretation |
|---|---|---|---|
| Google AI report, US | 800 impressions | Links appeared under Google’s report definition | 800 identifiable prospective customers |
| Selected AI referrers | 40 recorded sessions | Some visits retain recognizable source information | All visits influenced by AI |
| Orders in those sessions | 2 observed orders | A limited attributable set under the chosen method | 2 incremental sales caused by AI |
| Unknown-source orders | Source unresolved | Keep unresolved activity separate | Assign the remainder to whichever channel is growing |
Use prompt observations as a research panel
A small set of repeatable questions can help inspect product accuracy and source use. Record the question, date, interface, relevant market context and answer evidence. Note whether a citation appears and whether it actually supports the statement. Keep the original observation rather than only a yes/no brand-mention score.
Do not describe such a panel as the share of all users who see the brand. Answers can vary with context, time and the way a person asks. A hand-selected panel is useful for detecting specific information problems; it is not a representative audience survey unless it was designed and sampled for that purpose.
Choose questions around real buying decisions: what differs between two devices, which product version is available in the US, or what a kit contains. Repeating only favorable brand-name prompts makes the report look better while teaching the team less about discovery.
| Field | Why it is retained |
|---|---|
| Question and intended buyer decision | Makes the sample selection inspectable |
| Date, interface and market context | Preserves conditions that can change |
| Cited destination and relevant passage | Checks support, not just the presence of a link |
| Product/version accuracy | Identifies a concrete information problem |
| Proposed correction and owner | Connects observation to useful work |
Review changes against the question they were meant to solve
Keep a dated intervention log: corrected product name, improved comparison, repaired crawl access or added demonstration. Revisit the affected observations and page metrics after a reasonable period using the same definitions. Do not attribute every simultaneous change to the latest edit.
For low-volume stores, qualitative findings may be more useful than unstable percentages. A verified product error corrected across the brand’s sources is a real deliverable, even before the data supports a traffic conclusion. Conversely, an increase in impressions without relevant visits or commercial learning may not justify more of the same work.
Google’s AI optimization guidance keeps the focus on useful, accessible source material and ordinary search foundations. A measurement program should test whether that work helps people find and understand the product. It should not incentivize fabricated mentions, unnecessary pages or unsupported promises of citation placement.
What to ask an agency to deliver
Ask for a measurement dictionary, a source-grouping rule, a sample report with limitations and a repeatable review process. The team should explain which data comes from platform reporting, which comes from website analytics and which consists of manually observed answers. Request a usable export and ownership of the definitions.
Dahna can connect that reporting to the product-information and content work it informs. Bring the current analytics setup, relevant product URLs and a small set of questions customers actually ask. The result should tell the team what to inspect next, while keeping unknown influence and unqualified inquiries explicitly unknown.
Use this guide in your next brief
Download the tables from this guide as a working reference. Keep the example assumptions separate from your own figures, and record the source and date of any numbers you replace.
Sources & further reading
Plan your next AI search decision
Share your priority US product pages, current search/analytics reports and the AI-discovery question you need the reporting to answer.
Why consider Dahna for this work?
Dahna brings bilingual Korean and English strategy together with creator, content, and measurement work for brands growing in the US. You can review the people behind the recommendations and the kind of work we propose before starting a conversation.
Founder experience includes prior and contracted roles. Sample deliverables illustrate our approach; they are not client results or a performance promise.
External examples are research references, not Dahna client results or promised outcomes.