Which products actually contribute to your marketing budget?
Compare products using net revenue and an agreed cost model, not selling price or gross sales alone. Show cost coverage and distinguish product gross profit from a broader contribution estimate. A hero product can generate impressive revenue while leaving little room for acquisition or fulfillment costs.
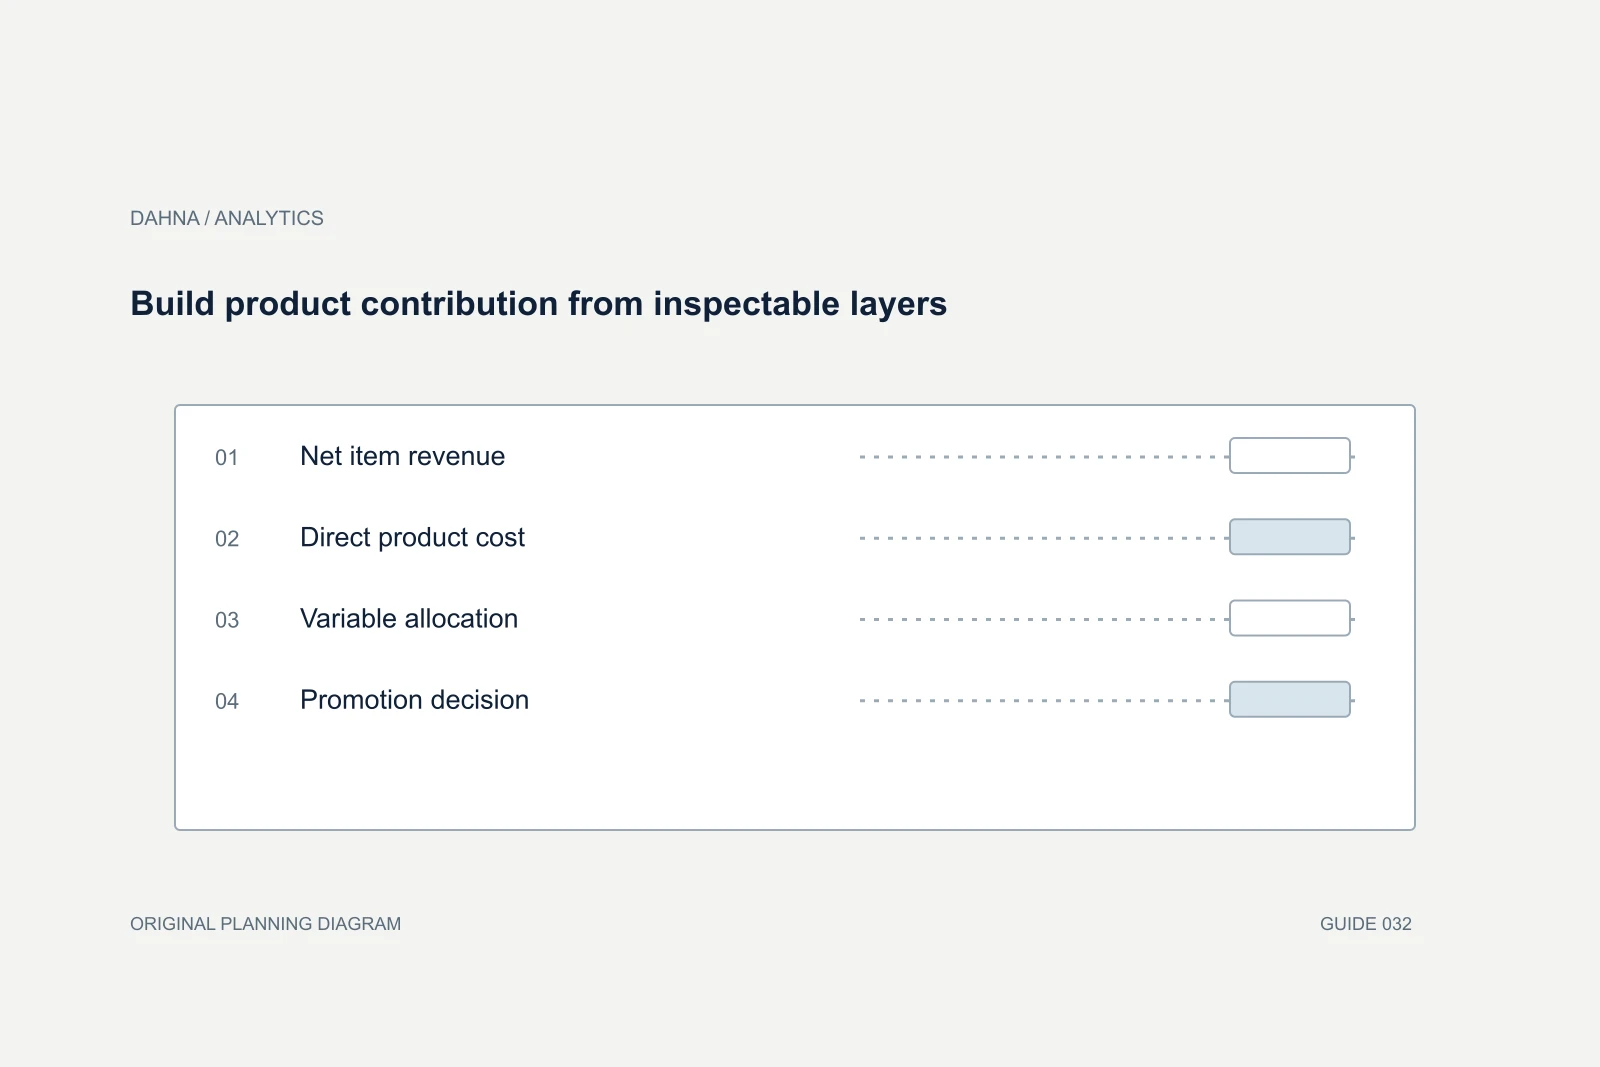
Dahna, original planning diagram
In this article
Overview
Compare products using net revenue and an agreed cost model, not selling price or gross sales alone. Show cost coverage and distinguish product gross profit from a broader contribution estimate. A hero product can generate impressive revenue while leaving little room for acquisition or fulfillment costs.
Choose the product unit you are comparing
A single SKU, a product family, a bundle, and an order are different units. Begin at the level where costs and quantities are reliable, then aggregate deliberately. A family-level average can hide a costly large size or a frequently returned shade. A bundle’s economics cannot be understood by adding retail prices of its components.
For the marketing decision, show both contribution per unit or order and total contribution over the period. A high-margin niche item may contribute little in total because it sells rarely, while a lower-margin repeat item may be important to the business. Neither measure should erase the other.
A blank cost field is a missing input
Shopify’s profit-report documentation notes that reported product profit depends on cost information recorded at the time of sale. That makes cost coverage an essential audit field. If some variants lack cost data, the report can exclude or misrepresent part of the commercial picture rather than reveal a true product advantage.
Ask the commerce and finance owners to approve the cost source, effective dates, and treatment of changing purchase costs. Marketing should not invent costs to complete a chart. Where estimates are necessary for planning, label them and show how the decision changes across a reasonable range.
| Input | Source or owner | Important check |
|---|---|---|
| Units and net sales | Commerce export | Returns and discounts treated consistently |
| Product cost | Approved finance or inventory record | Variant and effective date match |
| Payment and platform fees | Approved fee records or estimates | Avoid double-counting bundled fees |
| Fulfillment and packaging | Operations cost model | Order-level allocation is documented |
| Returns cost | Returns and finance records | Timing and recovery value are clear |
| Marketing cost | Campaign or allocation record | Do not imply SKU-level causality without evidence |
Apply discounts and returns before comparing products
A product’s full-price margin can differ greatly from its realized margin during a promotion. Shopify’s sales documentation defines gross and net measures and adjustments; use a consistent revenue basis for the report. A promotional bestseller should not be compared with a full-price item as though both sold at their catalog prices.
Returns may arrive after the sale period. Decide whether the report is a current-period operating view or a mature order-cohort view. Both can be useful, but they answer different questions. A campaign launched yesterday does not yet have a complete returns history.
Illustrative comparison of two products
Imagine Product A generates $10,000 in net revenue from 250 units. Its approved product cost is $4,000 and allocated variable operating costs are $1,500, leaving $4,500 before marketing. Product B generates $12,000 from 200 units, with $6,500 in product cost and $2,000 in variable operating costs, leaving $3,500 before marketing.
Product B has more revenue and a higher average net selling price, but Product A contributes more under this model. That does not automatically mean all promotion should move to A. Stock, customer acquisition role, repeat behavior, and product fit still matter. The calculation simply prevents revenue from being mistaken for available marketing room.
The figures are illustrative. A real report should show the cost categories and allocation method beside the result. If shipping is charged to the customer or subsidized differently by product, represent that consistently rather than hiding it inside a generic margin percentage.
| Measure | Product A | Product B |
|---|---|---|
| Net revenue | $10,000 | $12,000 |
| Units | 250 | 200 |
| Product cost | $4,000 | $6,500 |
| Allocated variable operating costs | $1,500 | $2,000 |
| Contribution before marketing | $4,500 | $3,500 |
| Contribution per unit | $18.00 | $17.50 |
Keep market and offer differences visible
The same product can have different economics in the US and Europe because of price, fulfillment, duties, returns, or channel fees. A global blended margin can be unsuitable for a US advertising decision. Split the report where those differences materially affect the choice.
Also distinguish ordinary purchases, subscriptions, wholesale, and marketplace sales when they use different economics. A single average may be acceptable for an overview, but the analyst should be able to show the underlying mix. Otherwise a channel shift can look like a product-cost problem.
Use the report to ask a better merchandising question
If a promoted item has weak contribution, investigate the cause before removing it from the plan. The issue could be discount depth, packaging cost, return behavior, or an offer that attracts the wrong customer. Some fixes belong to operations or product design rather than advertising.
If an item has attractive contribution but limited demand, a small evidence-led test may be appropriate. The margin does not create demand by itself. Pair the report with customer questions, search relevance, and creative readiness so the marketing decision reflects both economics and buyer interest.
Keep a launch estimate separate from a mature product record
A new product may have estimated landed cost, uncertain return behavior, and introductory fulfillment inefficiencies. Label the initial contribution view as provisional and show which inputs remain uncertain. Do not compare it with a mature bestseller’s fully reconciled economics as though both records have the same completeness.
Choose a review trigger such as receipt of the final cost invoice or completion of a reasonable returns observation period. When actual costs arrive, retain the approved planning version and explain the difference. This helps the team learn whether the original promotion decision was sensible under the information available at the time.
If a product appears unusually profitable because a cost is missing, remove it from the promotion ranking until the issue is resolved or show an explicit incomplete status. A dashboard should make that uncertainty visible before a media buyer uses it to allocate spend.
What a reliable product report should disclose
Ask for cost completeness, formulas, market scope, period maturity, and the allocation rule. Include a sample product that can be traced from order lines to the final contribution figure. The report should label estimates and avoid presenting contribution before fixed costs as company profit.
Dahna can help organize the reporting model and connect it to campaign and merchandising decisions, working with the brand’s approved finance and operations inputs. Bring the product export, cost records, return treatment, and the promotion choices under consideration.
Continue with the related decision
Use these guides when the next question goes beyond the scope of this article.
Use the editable decision sheet
Download the completed tables as a CSV, then replace the example inputs and add your evidence, owner and review date. Illustrative figures are teaching examples, not default targets.
Sources & further reading
Bring this decision to Dahna
Use this guide to prepare a focused brief. Tell Dahna what needs to change, which evidence you already have and when you need a decision.
Why consider Dahna for this work?
Dahna brings bilingual Korean and English strategy together with creator, content, and measurement work for brands growing in the US. You can review the people behind the recommendations and the kind of work we propose before starting a conversation.
Founder experience includes prior and contracted roles. Sample deliverables illustrate our approach; they are not client results or a performance promise.