Which belongs on your dashboard: MER, ROAS, or contribution?
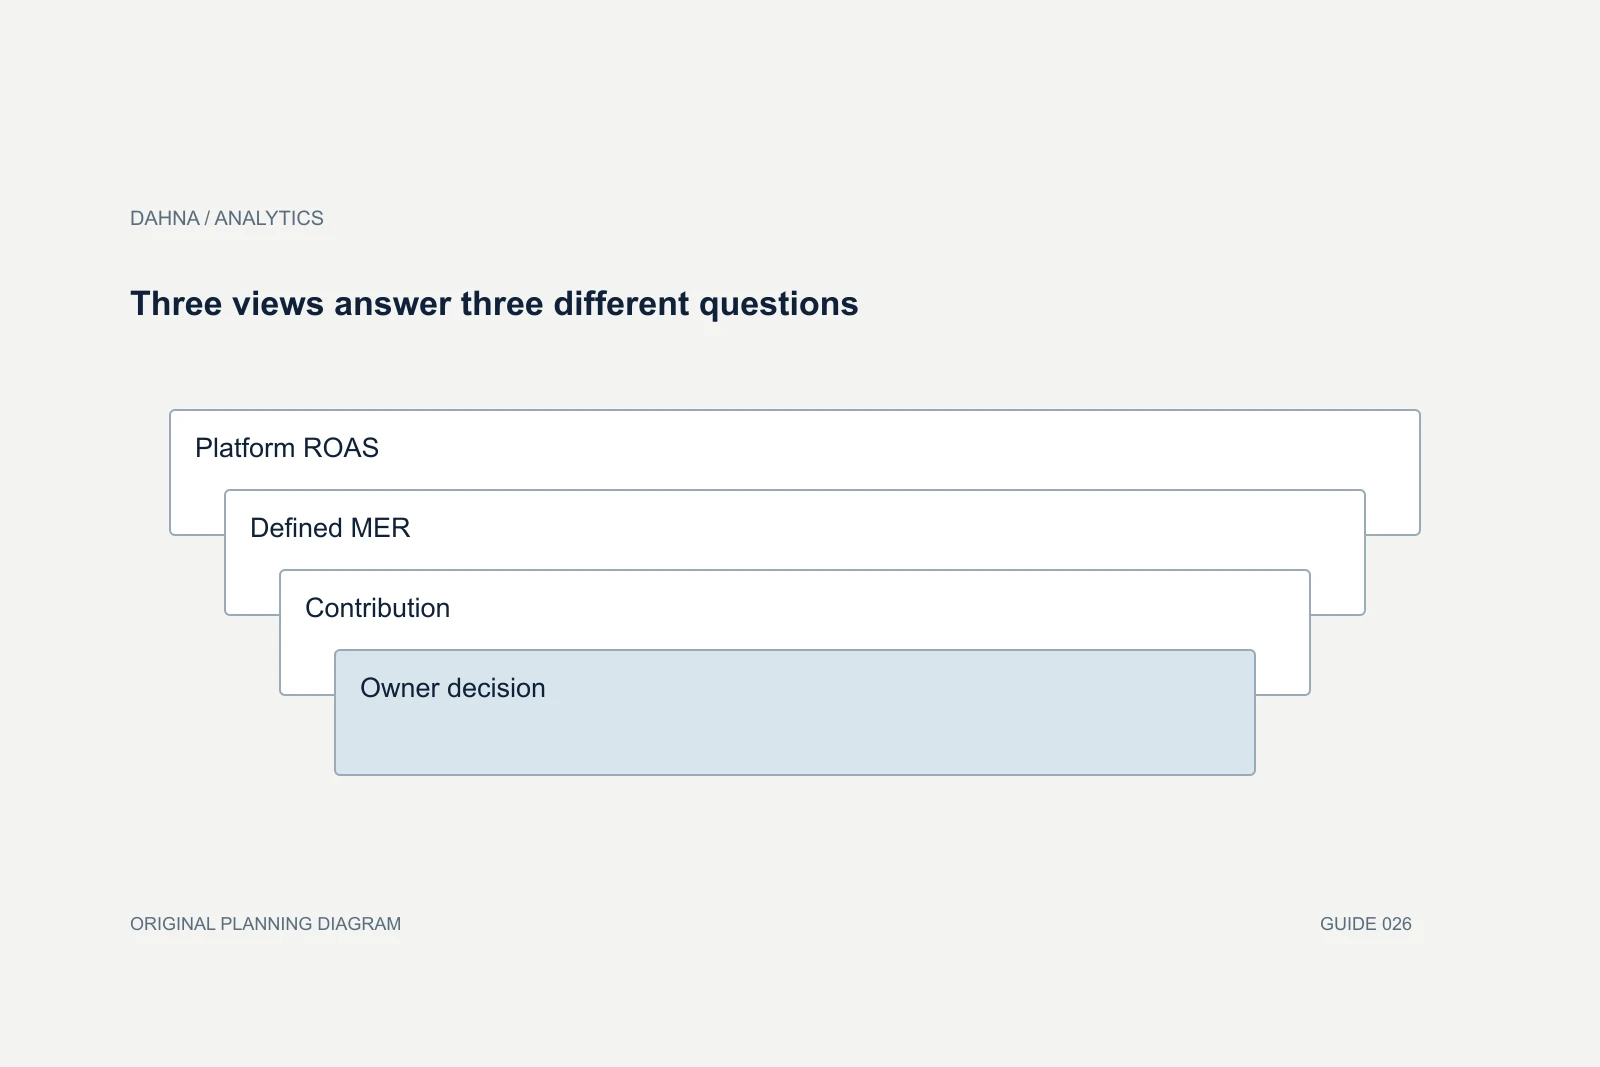
Use each measure for the question it can answer. A defined MER shows the relationship between total revenue and a chosen spend scope. Platform ROAS shows attributed revenue under that platform’s rules. Contribution shows what remains after agreed variable costs. None should silently stand in for the others.
Dahna, original planning diagram
In this article
Overview
Use each measure for the question it can answer. A defined MER shows the relationship between total revenue and a chosen spend scope. Platform ROAS shows attributed revenue under that platform’s rules. Contribution shows what remains after agreed variable costs. None should silently stand in for the others.
Define the formulas on the dashboard itself
MER is used inconsistently across businesses. For this article’s illustrative dashboard, define it as net merchandise revenue divided by media spend. If your business includes agency and creative costs in the denominator, give that version a distinct label. A metric acronym is not a substitute for a definition.
ROAS also needs context: platform, attribution window, revenue treatment, and included campaign set. A Meta result and a Google result may both claim credit for one order. Adding their attributed revenue is not a reliable way to calculate total store revenue. Keep the store’s agreed revenue population separate from platform credit.
Build a revenue bridge before an efficiency ratio
Start with the agreed sales measure and show how discounts, returns, and other adjustments produce the revenue used in the report. Shopify documents several sales measures and report treatments, so use the definition that matches the decision rather than assuming every “sales” field is interchangeable.
For international brands, state the currency conversion convention and market scope. A change in exchange rates can alter a consolidated chart without the same change in local customer behavior. Keep US performance visible when the budget decision concerns the US operation.
| Line | Illustrative amount | Meaning |
|---|---|---|
| Gross merchandise sales | $120,000 | Before the adjustments below |
| Discounts | −$10,000 | Agreed promotional reductions |
| Returns and refunds | −$5,000 | Applied once under the stated convention |
| Net merchandise revenue | $105,000 | Revenue basis for this example |
| Product and variable operating costs | −$45,000 | Illustrative agreed cost scope |
| Contribution before media | $60,000 | Available before media and other excluded costs |
| Media spend | −$30,000 | Paid distribution cost |
| Contribution after media | $30,000 | Not final company profit |
Read the views together without forcing agreement
In the example, net-revenue MER is $105,000 divided by $30,000, or 3.5. If platforms report $150,000 of attributed revenue, their combined claimed ratio would look like 5.0, but overlapping credit means it is not a store-level return measure. The contribution view shows $30,000 after media under the stated cost assumptions.
That remaining amount still needs to cover excluded costs such as fixed payroll, rent, or other overhead. Calling it net profit would overstate the result. Shopify’s profit-report documentation also makes clear that product-cost coverage affects its reports; a missing cost is not a free product. The management dashboard must show gaps rather than treating blanks as zero.
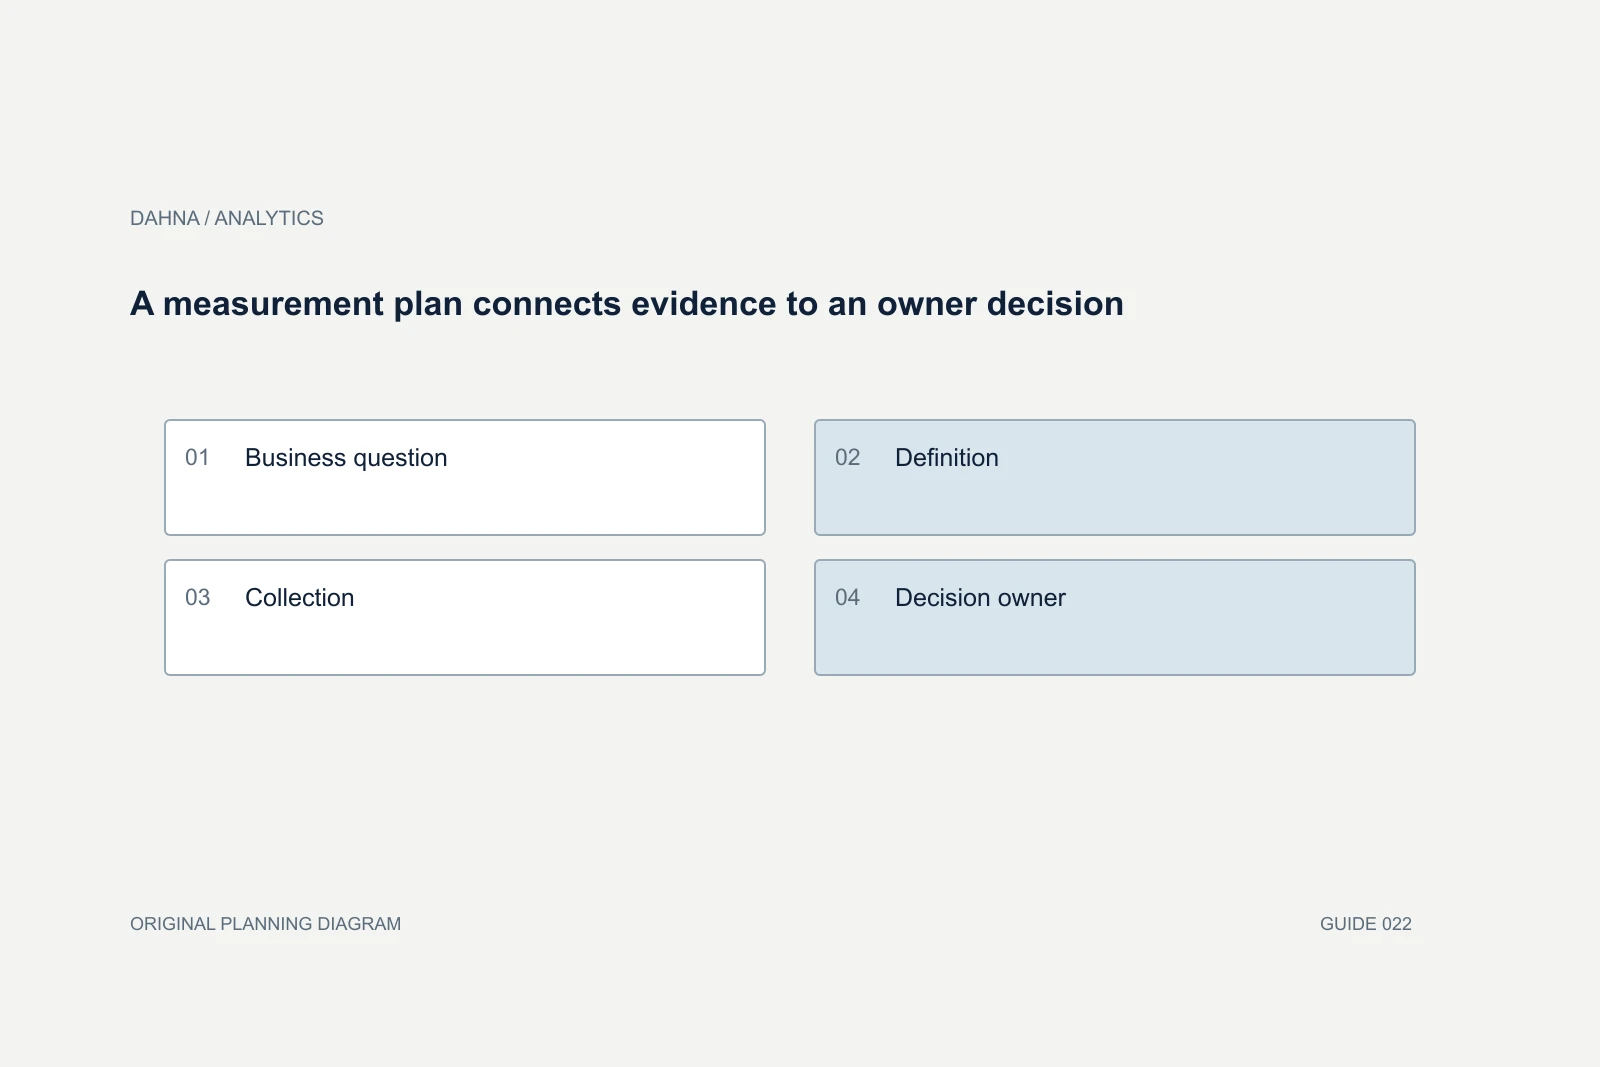
Three views answer three different questions
Platform ROAS
What revenue did this platform attribute under its rules?
Defined MER
How does agreed store revenue compare with spend?
Contribution
What remains after the costs included in this model?
Owner decision
Which change is justified after considering all three?
A higher ratio can hide a weaker business
MER can rise when a brand cuts acquisition spending and relies on existing customers. That may improve short-term efficiency while reducing future customer additions. Platform ROAS can rise when campaigns concentrate on people already close to buying. Contribution can fall even as revenue grows if discounts, returns, or fulfillment costs increase.
Add new-customer counts, inventory context, and cost completeness to the interpretation. The point is not to dismiss any metric. It is to prevent the team from optimizing a ratio while ignoring the behavior that produced it. A useful dashboard should make these tradeoffs visible in one discussion.
Illustrative comparison of two campaign months
Imagine Month A has $100,000 in net revenue, $25,000 in media spend, and $50,000 in variable product and operating costs. Its defined MER is 4.0 and contribution after media is $25,000. Month B has $120,000 in net revenue, $30,000 in media spend, and $70,000 in variable costs. MER remains 4.0, but contribution after media falls to $20,000.
The ratio alone would suggest stable efficiency. The bridge reveals a margin problem. The team investigates whether a discount, a lower-margin product mix, or higher returns caused the cost increase. It does not automatically blame the media buyer or increase spending because sales grew.
These numbers are fictional. The useful lesson is that a business can hold the same revenue-to-spend ratio while producing a different amount to cover the rest of its costs. A well-designed dashboard lets the owner see that difference before approving the next budget.
Make provisional costs visible
Some costs and refunds arrive after the reporting week. Use a clearly labeled provisional view if necessary, then reconcile it when actual records are available. Do not quietly overwrite a forecast with an actual value and leave earlier decisions unexplained. The report should show when a number became sufficiently complete for a larger budget decision.
Choose a consistent treatment for creator fees, agency retainers, and production costs. They may appear in a broader contribution-after-marketing view rather than the media-only view. Show both when useful, but avoid subtracting the same cost twice. The finance owner should approve the commercial definitions.
Require an inspectable dashboard, not just a visual one
Every headline tile should link back to its formula and source. The report should state whether the period is complete, whether costs are actual or estimated, and whether the market and currency are consistent. A reader should be able to reproduce a sample calculation with a calculator.
Use charts only when their units and populations are clear. A revenue line and a ratio line can be useful on separate axes, but unlabeled scales can make a small movement look dramatic. Tables often provide the clearest first version of the commercial bridge.
| Question | Required detail |
|---|---|
| What revenue is used? | Gross/net definition, market and adjustments |
| What spend is included? | Media-only or broader marketing scope |
| How is attribution labeled? | Platform and window with overlapping credit acknowledged |
| Which costs are missing? | Coverage and provisional estimates |
| What decision follows? | A named action or further investigation |
Use a break in the bridge to assign the next investigation
If net revenue is stable but contribution declines, inspect costs, discounts, returns, and product mix before asking for a new attribution model. If contribution is healthy but new-customer additions fall, inspect the balance between acquisition and repeat demand. If platform ROAS changes while store revenue does not, examine attribution and campaign mix before declaring business growth or decline.
These are diagnostic starting points, not automatic conclusions. The dashboard should link each pattern to a specific source view and owner. A short note such as “returns are still provisional for this cohort” can be more useful than another chart. Keep the previous version of the bridge when late costs are reconciled so the team can understand why the decision changed. This turns the dashboard into an inspectable management record rather than a collection of numbers that silently move after the meeting.
How Dahna can make the report decision-ready
Dahna can help align the metric definitions, reconcile the source records, and design a dashboard that shows the tradeoffs behind campaign performance. Bring your store revenue exports, platform spend, and approved cost categories. The work should complement the finance team’s reporting rather than claim to replace it.
The best outcome is a clearer budget conversation: which activity brings relevant customers, what those sales contribute, and which uncertainty still needs to be resolved.
Continue with the related decision
Use these guides when the next question goes beyond the scope of this article.
Use the editable decision sheet
Download the completed tables as a CSV, then replace the example inputs and add your evidence, owner and review date. Illustrative figures are teaching examples, not default targets.
Sources & further reading
Bring this decision to Dahna
Use this guide to prepare a focused brief. Tell Dahna what needs to change, which evidence you already have and when you need a decision.
Why consider Dahna for this work?
Dahna brings bilingual Korean and English strategy together with creator, content, and measurement work for brands growing in the US. You can review the people behind the recommendations and the kind of work we propose before starting a conversation.
Founder experience includes prior and contracted roles. Sample deliverables illustrate our approach; they are not client results or a performance promise.