Why didn't our influencer campaign sell? A diagnosis checklist
Find where an influencer campaign lost sales with eight checks from reach to purchase, a symptom table, a worked example and a worksheet.

Why didn’t the influencer campaign sell?
Say you sell a serum and sent it to 15 creators. Twelve posted over ten days. The videos got views. Your first report shows 18 orders. Now your team asks whether creators just don’t work for your brand. This brand and its numbers are invented for illustration.
When an influencer campaign didn’t sell, there are eight places to look. The creators may have reached the wrong audience. The brief may have been weak. Viewers may have had no reason to buy now. The link or code may have failed. The product page or price may have lost them. The product may have been out of stock or slow to ship. Or sales happened and weren’t counted. Or the campaign was too small to judge.
Check volume, counting, links and stock first, because those are facts in your own systems. You can look them up instead of guessing.
The steps below tell you what to check. They also say where the data lives and what a problem looks like. No step carries an industry benchmark. We found none we could check in a primary source. Where a threshold appears, it’s our judgment, and it’s labelled. Every number in the worked example is invented.
What should you check first, and in what order?
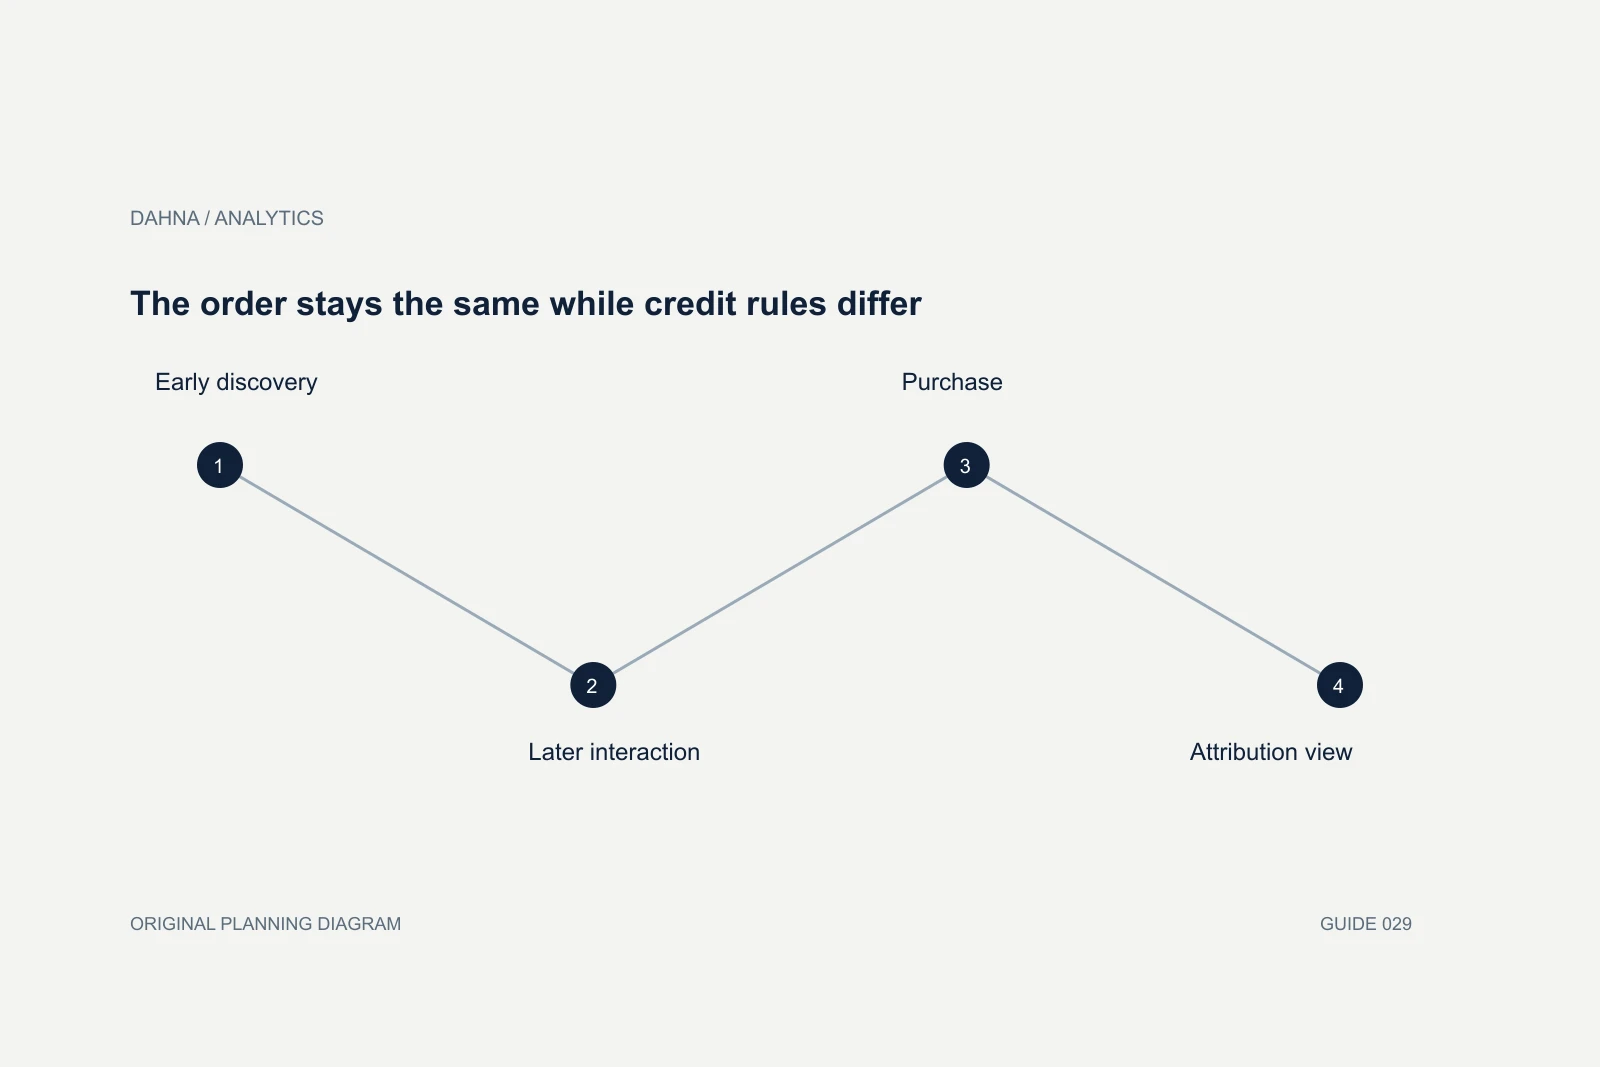
Run the eight checks roughly in reverse of the buyer’s path, starting with facts you can look up. The table follows the buyer from seeing the video to getting the order. Run the checks in a different order: step 8 first, then 7, 4 and 6, then 5, and last 3, 2 and 1.
In plain terms, you check volume first, then counting, links and codes, and stock. Next comes the product page and price. Last come the offer, the brief and the creators.
The later steps in the table are facts you can look up. The early ones are judgments about people and creative. Those are much easier to make once you know the counting and the mechanics worked.
Eight checks from reach to purchase
| Step | What to check | Where the data lives | What a problem looks like |
|---|---|---|---|
| 1. Creators and audience | Whether each creator's viewers are in the US and buy this kind of product | The creator's audience report from the platform; comments on the videos | High views, comments about the creator and few about the product; most viewers outside the US |
| 2. Brief | Whether each video shows the product in use, names it and says where to buy | The brief you sent; the posted videos | The product appears late or briefly; the name or the place to buy is missing |
| 3. Reason to buy now | Whether there was an offer, a deadline or a launch | The brief, the captions, your promotion calendar | Videos praise the product and give no price, offer or end date |
| 4. Link and code | Whether every link opened the right page and every code applied at checkout | Your own test on a phone; the link tool's click report; the discount report | Clicks with no sessions; a code that returns an error; a link to the home page |
| 5. Product page and price | Whether the page matches the video and the total with shipping is what viewers expected | Store analytics for campaign sessions: product page, cart and checkout steps | Sessions arrive and few add to cart, or carts stop at shipping |
| 6. Stock and shipping | Whether the featured product and shade were in stock throughout, and what delivery time was shown | Inventory history; order and support records | Sold out during the posting days; long delivery estimates |
| 7. Counting | Whether the report you read missed orders | Tagged-link report, discount code report, marketplace reports, post-purchase survey | Code orders exceed tagged orders; direct and search orders rise during the campaign |
| 8. Volume | Whether there were enough videos, clicks and orders to conclude anything | Counts of videos posted, clicks, sessions and orders | A handful of videos or a few dozen clicks |
Was there enough volume to judge the campaign?
Start with volume, because a small campaign can’t answer the question. Say five creators posted and the links got a few dozen clicks. Zero orders and three orders are then hard to tell apart.
We know of no primary source that sets a minimum, so this is our judgment. Before you compare creators with each other, look for enough sessions that one order more or less wouldn’t change your conclusion.
Below that level, your finding is that the test was too small. The next step is a larger test with the same tracking. The result says nothing yet about whether creators can sell your product.
Count how many creators posted at all. In the serum example, 12 of the 15 did. If your gifted creators stayed silent, our guide to influencer gifting that got no posts covers that problem.
Did sales happen that your report didn’t count?
Check counting next, before you judge the creators or the videos. Each tracking method misses orders in a known way. We read the pages below on November 11, 2026.
Start with tagged links. A tagged link, or UTM link, is a web address with labels added. The labels tell your analytics which campaign sent the visit. Google’s Analytics help says UTM values are case sensitive. So utm_source=google and utm_source=Google are different values. It also says missing parameters appear as (not set) in reports. By our reading, a creator who retypes a link or drops part of it can split or lose the campaign’s sessions.
Then check last click. In Google Analytics, the paid and organic last click model ignores direct visits. It gives all the credit to the last channel the customer clicked before converting. Shopify’s total sales by referrer report also shows the last interaction referrer. Shopify lists cases where the referrer can’t be determined. Two examples are a link clicked from a mobile app and a shortened URL.
Under those rules, a viewer may watch a video and search for your brand the next day. That sale is counted under search. A viewer who taps through from inside an app may be counted as direct.
Then check codes. Shopify’s sales by discount codes report gives the number of orders each code was applied to. Compare it with the tagged-link report. Orders that used a creator’s code but carried no campaign tag were missed by the link report. A code can spread beyond the creator’s audience. So in our view, code orders are an upper estimate.
Marketplaces have their own windows. An attribution window is the period after a click or a view when a sale gets credited to the ad. For TikTok Shop ads, TikTok’s help page (last updated August 2025) gives a window of 7 days after a click and 1 day after a view. It notes that Seller Center reports sales on the day they happen. TikTok Ads Manager reports sales within the attribution window. So two TikTok reports for the same days can disagree.
We couldn’t read Meta’s help page on attribution settings. So Meta’s windows aren’t stated here. We also have no sourced figure for how long to wait before judging a campaign. Wait at least as long as the attribution window of the report you’re reading.
A one-question post-purchase survey catches buyers that links and codes miss. If the gaps are large, fix the counting before your next campaign. Setting up this kind of measurement is part of Dahna’s analytics and growth strategy service.
Did the link, the code and the stock work?
Test the link, the code and the stock yourself. Use a phone, from inside the app where the video ran. Open each creator’s link. Confirm it lands on the featured product with the campaign tags still in the address. Enter each code at checkout with the featured product in the cart.
Then pull the inventory history for the campaign days, by shade or size. Say a featured shade sold out on day three. That explains a flat second week more simply than anything about the creators. Look at the delivery estimate shown at checkout on those days too.
Did the campaign run on TikTok Shop? Then see our guide to how much stock to reserve for a TikTok Shop campaign.
Did the product page or the price lose the sale?
If tagged sessions arrived but few added to cart, look at the page those viewers landed on. Compare it with the video. Check the product, the shade or size, the claim the creator made and the offer the creator promised. Then compare the total at checkout, with shipping and tax, against the price said in the video.
Your store analytics shows where campaign sessions stopped: on the product page, at the cart or at shipping. We give no benchmark for a good add-to-cart rate. Instead, compare campaign sessions with your own sessions from other sources over the same days.
Fixing what happens after the click is the work of Dahna’s conversion and shopping experience service. The same comparison for paid ads is in our guide to ad-to-landing-page mismatch.
Was it the offer, the brief or the creators?
Ask about the offer, the brief and the creators only after the mechanics pass. Watch every video with the sound on. Note when the product first appears. Note whether the creator says its name and where to buy it. Note whether there’s a reason to act now, such as a launch price or an end date.
A video that entertains and never says how to buy can collect views and no clicks. So check each video against what the brief asked for.
For audience fit, ask each creator for the platform’s audience report: country, age and how many viewers were followers. Then read the comments. In our view, questions about shade, price or shipping suggest people who might buy. Comments about the creator’s life tell you little about the product.
One strong video doesn’t make a creator a fit, and one weak video doesn’t rule a creator out. Our guide to evaluating TikTok influencer performance shows how to read a creator’s recent posts as a set. Choosing and briefing creators is the work of Dahna’s influencer and creator marketing service.
Which symptom points to which cause?
Use the symptom table once you have the numbers from the checks above. More than one row can apply to one campaign, so don’t stop at the first match.
Symptom, likely cause and next step
| Symptom | Likely cause | Next step |
|---|---|---|
| Few videos posted and few clicks in total | Too little volume (step 8) | Run a larger test with the same tracking before concluding |
| High views, very few link clicks | Brief or reason to buy (steps 2 and 3), or the wrong audience (step 1) | Rewatch for product, name, where to buy and offer; check audience country |
| Clicks in the link tool, far fewer tagged sessions | Link or tags broken (step 4) | Test every link in the app; repair tags and redirects |
| Sessions arrive, few add to cart | Page does not match the video, or price (step 5) | Compare the page with the video and with your other traffic |
| Carts added, few checkouts completed | Shipping cost, delivery time or a failing code (steps 4 to 6) | Test the code; review what checkout shows for shipping |
| Sales stop partway through | Stock ran out (step 6) | Check inventory by day and by shade |
| Code orders exceed tagged orders; direct or search orders rise | Sales not counted (step 7) | Combine code and tagged orders; add a post-purchase survey |
| Sales came from one or two creators | Creator fit varies (step 1) | Keep those creators and study what their videos did |
What does a finished influencer campaign diagnosis look like?
Here’s the finished diagnosis for the serum campaign from the start, with invented numbers for an invented skincare brand. Fifteen creators were sent a serum. Twelve posted over ten days. The first report showed 18 orders. The discount report showed 31 orders using creator codes: the 18 tagged orders and 13 with no tag.
Now read it in checklist order. Volume: in our judgment, 31 orders across 12 creators is enough to say the campaign sold something. It’s too few to rank the creators against each other. Counting: the first report missed 13 of the 31 orders identified.
Links: a quarter of clicks lost their tags, which points to one or more creators posting an untagged link. Stock: in this example, one of three shades was sold out for four of the ten days.
So the brand’s first repairs are tracking, links and stock. After those, it’s worth asking why three creators produced 60 percent of the clicks.
An invented campaign: the numbers behind the diagnosis
| Measure | Invented figure | Calculation | Reading |
|---|---|---|---|
| Creators who posted | 12 of 15 | 12 / 15 = 80.0 percent | Three videos never ran |
| Video views | 240,000 | From the creators' reports | The videos were seen |
| Link clicks | 1,920 | 1,920 / 240,000 = 0.80 percent of views | 1,152 clicks (60.0 percent) came from three creators |
| Tagged sessions | 1,440 | 1,440 / 1,920 = 75.0 percent of clicks | 480 clicks arrived without tags |
| Add to cart | 72 | 72 / 1,440 = 5.00 percent of tagged sessions | Compare with the store's other traffic |
| Orders with the campaign tag | 18 | 18 / 1,440 = 1.25 percent of tagged sessions | The figure in the first report |
| Code orders without the tag | 13 | 31 code orders minus 18 tagged orders | Missed by the link report |
| Orders identified | 31 | 18 + 13 = 31; 13 / 31 = 41.9 percent uncounted | 31 / 12 = 2.6 orders per posting creator |
What should you do before the next influencer campaign?
Set up the basics below before the first video of your next campaign goes live. The worksheet has the eight checks with columns for what you found and the evidence, plus the funnel calculations.
A naming rule for tags is in our guide to a UTM naming standard. All beauty and K-beauty marketing guides are on one page. Our skincare page describes how Dahna works with skincare brands.
- Give every creator a unique tagged link and a unique code, and test both inside the app. Without both, you can’t run steps 4 and 7, the link and code check and the counting check.
- Send links ready to paste, so nobody retypes them.
- Confirm stock by shade for the whole posting period.
- Put the product name, where to buy and the offer in the brief.
- Add one post-purchase survey question.
- Decide in advance how many videos and sessions you need before you draw a conclusion.
- Decide whether your goal is sales, content or reach. Views without sales may have value, and this checklist doesn’t measure it.
In summary
When an influencer campaign didn’t sell, check eight things in this order: volume, counting, link and code, stock, product page and price, offer, brief, creators. The first four are facts in your own systems. They can hide sales that really did happen. Judge the creators only after those four pass.
Sources & further reading
- URL builders: Collect campaign data with custom URLs (checked November 11, 2026)Google Analytics Help
- Get started with attribution (checked November 11, 2026)Google Analytics Help
- Sales reports (checked November 11, 2026)Shopify Help Center
- About attribution for TikTok Shop Ads, last updated August 2025 (checked November 11, 2026)TikTok Business Help Center
Find where the sale was lost before you book more creators.
Dahna is a new agency with no client results to publish. If your campaign reached people and orders did not follow, send us the numbers from the checklist and we can go through the product page, checkout and tracking with you.
Platform help pages were read on November 11, 2026 and can change. The article gives no benchmarks.